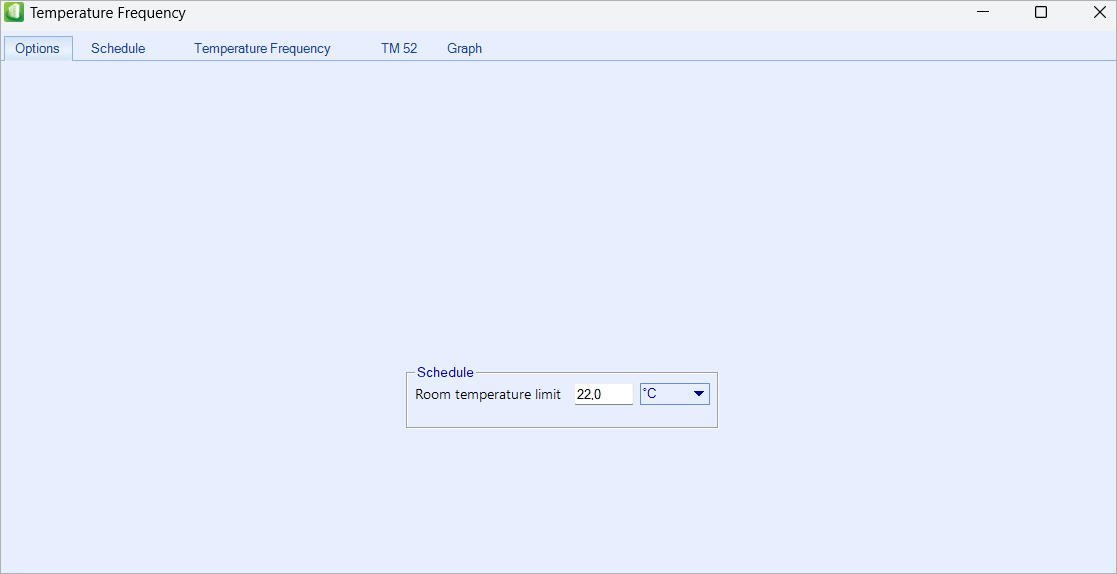
| Options
|
Sets the room temperature limit.
|
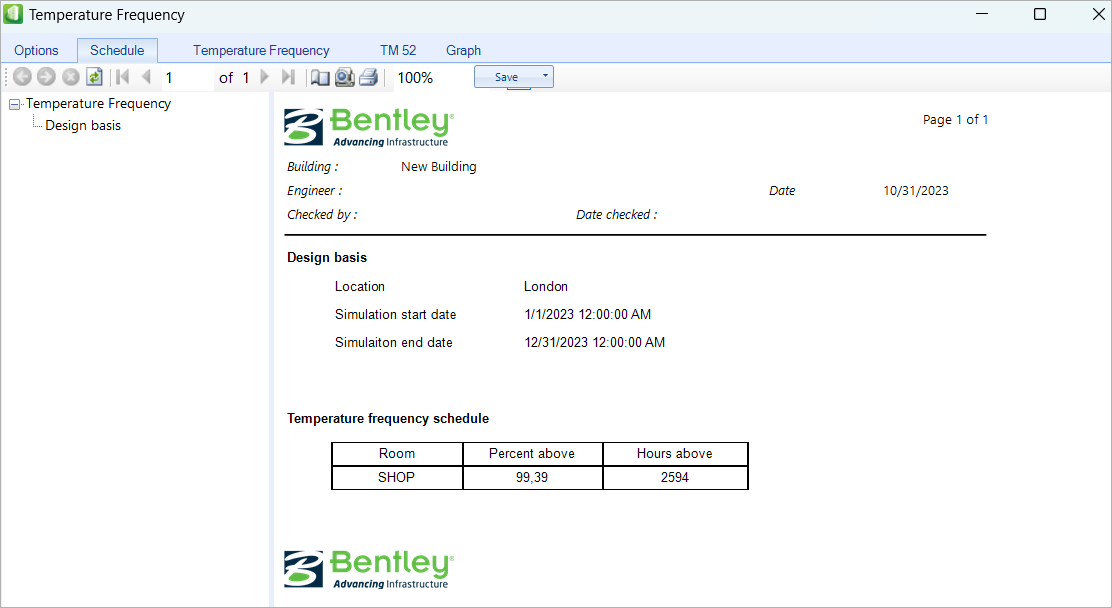
| Schedule
|
Displays the scheduled Thermal Frequency Simulation
to the desired set period. Displays the location of the room, start date, and
end date for thermal frequency simulation. You can save this report in
different file formats available under the save drop-down menu.
|
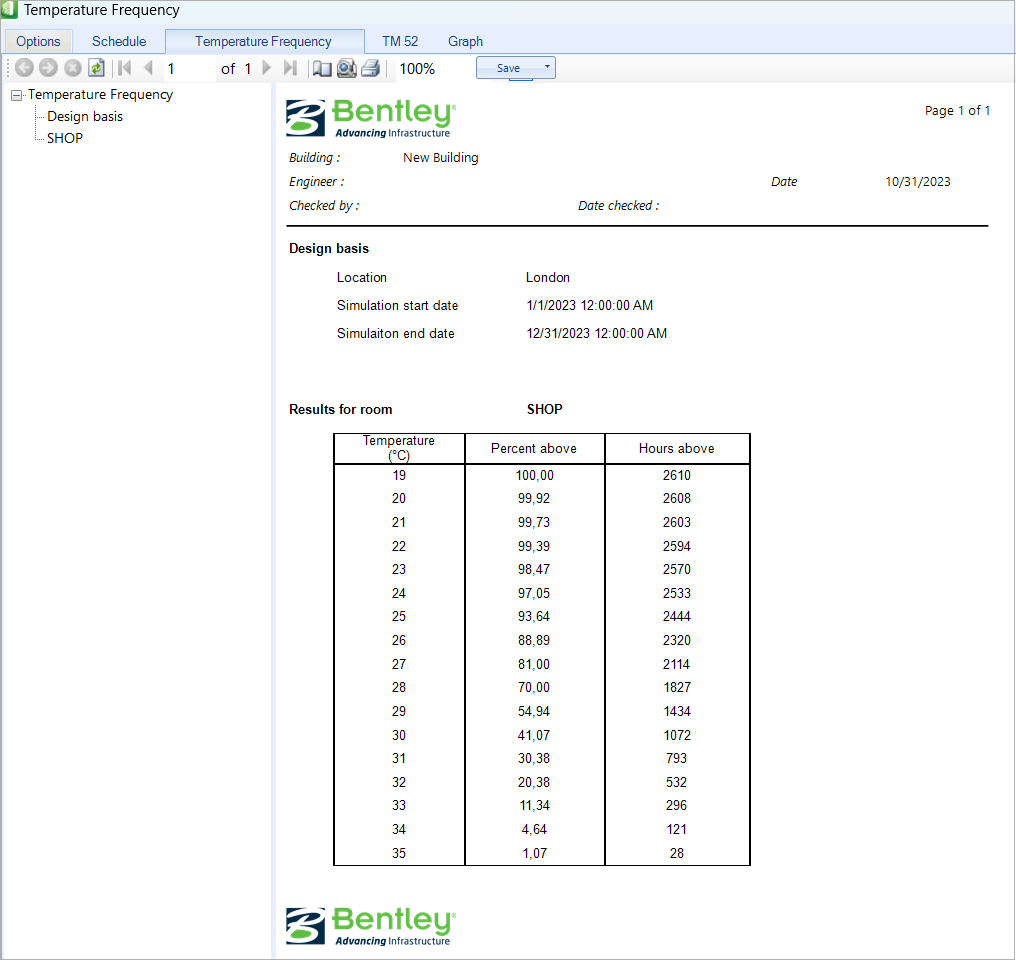
| Temperature Frequency
|
Lists the distribution of temperature values above
the percent and above the hours for each room.
|
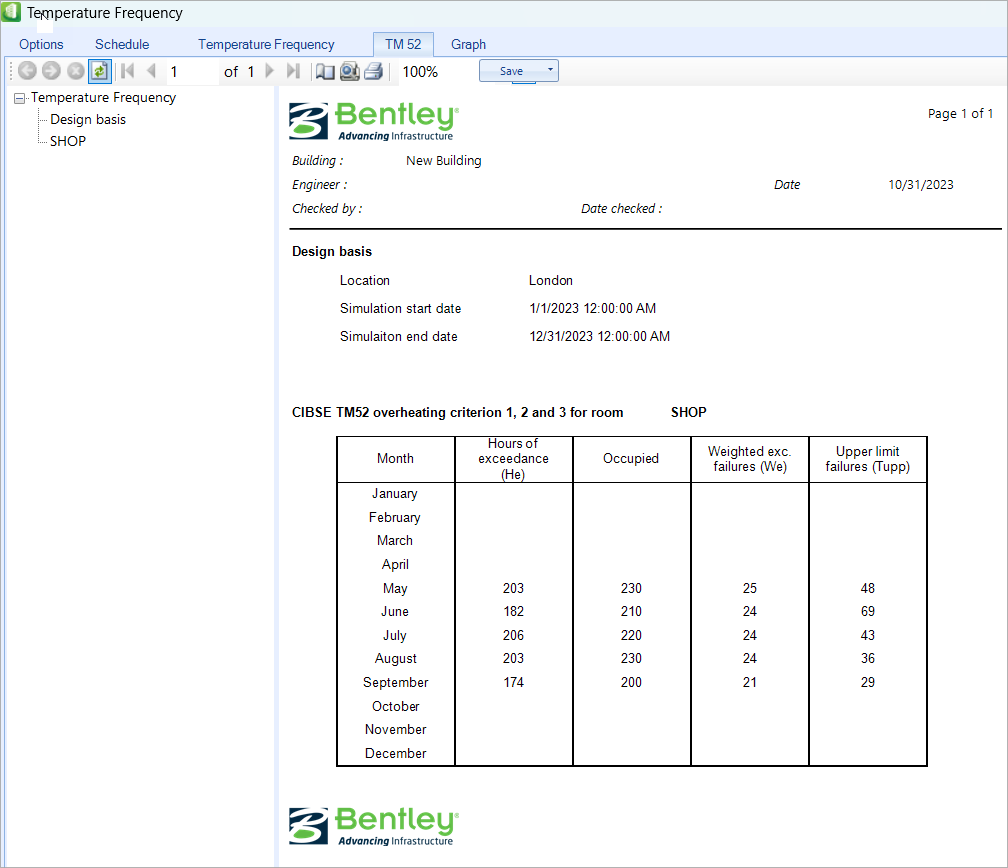
| TM 52
|
Displays the temperature frequency simulation
result. It shows the CIBSE TM52 energy efficiency with respect to the number of
occupants for the set period.
|
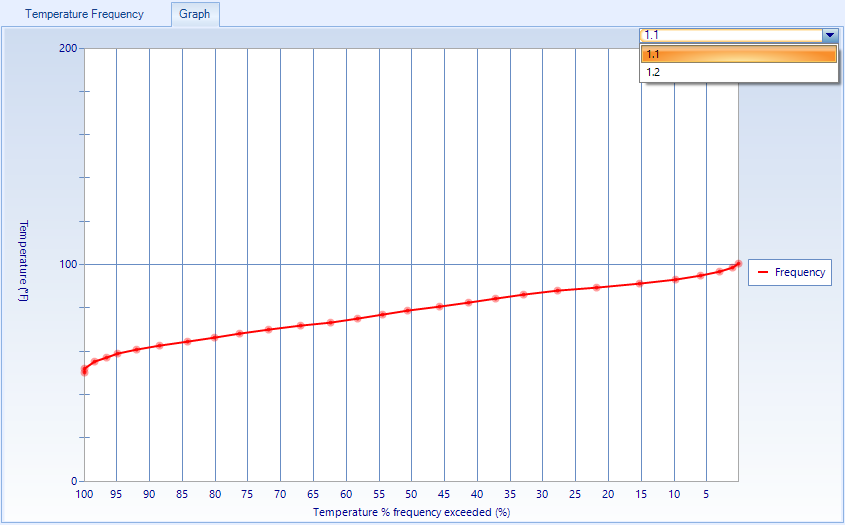
| Graph
|
Contains controls used to view a graphical report of
the simulation temperatures result. Select a room from the list to update the
graph.
The temperature frequency graph for selected room
can be displayed. The pattern of the temperature exceeding the above is shown
as a colored curve.
- Temperature - The
temperature values are displayed on the graph's vertical (Y) axis. The scale is
automatically adjusted when viewing smaller or larger values making it easier
to distinguish the separate graph curves.
- Temp frequency
exceeded - The percentage values of the design temperature exceeded are
displayed on the graph's horizontal (X) axis.
- Curve - Temperature
distribution patten for the selected room or project are displayed with color
coded curves. The color codes are described in the graph legend. The curves and
legend are interactive, providing you with pop up help windows.
|